free command examples
Type the free command at shell prompt to display amount of free and used memory in the system in human readable format from /proc/meminfo:
Output:
$ free
$ free -m
Output:
             total       used       free     shared    buffers     cached
Mem:          2010       1965         45          0        152        776
-/+ buffers/cache:       1036        974
Swap:         2047        137       1910
The -b,-k,-m,-g option show output in bytes, KB, MB, or GB. As I said eariler you use cat command to display contents of /proc/meminfo:
Sample outputs:
$ cat /proc/meminfo
$ less /proc/meminfo
Sample outputs:
MemTotal:       12195116 kB
MemFree:          157328 kB
Buffers:          375424 kB
Cached:          9298412 kB
SwapCached:        22616 kB
Active:          5714924 kB
Inactive:        5473744 kB
Active(anon):     870136 kB
Inactive(anon):   644700 kB
Active(file):    4844788 kB
Inactive(file):  4829044 kB
Unevictable:           0 kB
Mlocked:               0 kB
SwapTotal:       6291448 kB
SwapFree:        6168080 kB
Dirty:             35760 kB
Writeback:             0 kB
AnonPages:       1493084 kB
Mapped:           567616 kB
Shmem:                 4 kB
Slab:             667828 kB
SReclaimable:     566912 kB
SUnreclaim:       100916 kB
KernelStack:        3240 kB
PageTables:        54692 kB
NFS_Unstable:          0 kB
Bounce:                0 kB
WritebackTmp:          0 kB
CommitLimit:    12389004 kB
Committed_AS:    4022128 kB
VmallocTotal:   34359738367 kB
VmallocUsed:       52908 kB
VmallocChunk:   34359680588 kB
HardwareCorrupted:     0 kB
AnonHugePages:   1212416 kB
HugePages_Total:       0
HugePages_Free:        0
HugePages_Rsvd:        0
HugePages_Surp:        0
Hugepagesize:       2048 kB
DirectMap4k:        7488 kB
DirectMap2M:    12574720 kB
Update free command every [delay] seconds
To update every 5 seconds, enter:
Pass the -c option to update [count] times i.e. update free command every 2 seconds 3 times, enter:
Sample outputs:
# free -s 5Pass the -c option to update [count] times i.e. update free command every 2 seconds 3 times, enter:
# free -s 2 -c 3Sample outputs:
             total       used       free     shared    buffers     cached
Mem:      12195116   11992716     202400          0     374820    9255356
-/+ buffers/cache:    2362540    9832576
Swap:      6291448     123368    6168080

             total       used       free     shared    buffers     cached
Mem:      12195116   11992468     202648          0     374820    9255112
-/+ buffers/cache:    2362536    9832580
Swap:      6291448     123368    6168080

             total       used       free     shared    buffers     cached
Mem:      12195116   11993700     201416          0     374824    9255140
-/+ buffers/cache:    2363736    9831380
Swap:      6291448     123368    6168080
Sai hello to top / atop / htop commands
The top command display Linux tasks including memory used by process. atop command orhtop commands are top like tools with additional options:
Sample outputs:
# top# atop# htopSample outputs:
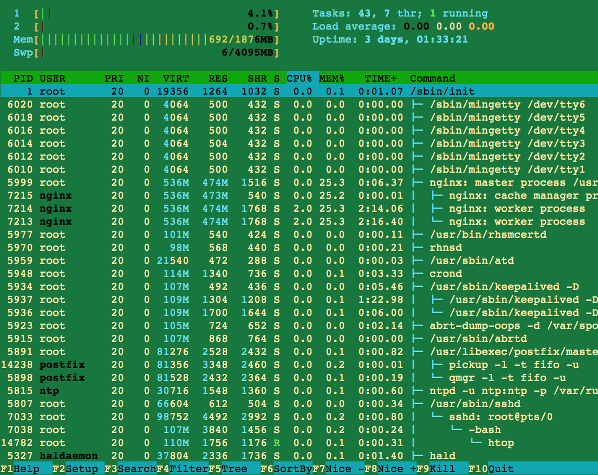
Fig.01 htop command in action
vmstat command examples
vmstat command provides more information :
Output:
$ vmstatOutput:
procs -----------memory---------- ---swap-- -----io---- --system-- -----cpu------
 r  b   swpd   free   buff  cache   si   so    bi    bo   in   cs us sy id wa st
 0  0 140480  43636 158196 797692    1    0   108   220    1    4  7  5 87  1  0
Understanding vmstat memory options
- swpd: the amount of virtual memory used.
- free: the amount of idle memory.
- buff: the amount of memory used as buffers.
- cache: the amount of memory used as cache.
- inact: the amount of inactive memory (see -a option).
- active: the amount of active memory (see -a option).
$ vmstat -aOutput:
procs -----------memory---------- ---swap-- -----io---- --system-- -----cpu------
 r  b   swpd   free  inact active   si   so    bi    bo   in   cs us sy id wa st
 0  1 140480  37376 109516 1730040    1    0   108   220    1    4  7  5 87  1  0
The following command displays one new line of utilization data every second
The following command displays one new line per 2 second, but only for the next 10 seconds:
Sample outputs:
$ vmstat 1The following command displays one new line per 2 second, but only for the next 10 seconds:
$ vmstat 2 10Sample outputs:
procs -----------memory---------- ---swap-- -----io---- --system-- -----cpu------
 r  b   swpd   free  inact active   si   so    bi    bo   in   cs us sy id wa st
 4  0 139216  23508 130644 1723680    1    0   108   220    1    5  7  5 87  1  0
 2  0 139216  23252 130668 1723816    0    0     0   410 3242 11472  9  7 84  0  0
 1  0 139216  23120 130656 1724012    0    0     0   750 3280 11592  3  6 90  1  0
 0  0 139216  22996 130588 1724180    0    0     0   426 3272 11052  2  5 93  0  0
 2  0 139216  20988 129932 1726980    0    0     6  1146 3353 12105 14  9 74  2  0
 1  0 139216  20244 129900 1727216    0    0     0   392 3238 11752  8  7 85  0  0
 1  0 139216  20120 129868 1727352    0    0     0   444 3197 11173  2  5 93  0  0
 1  0 139216  25964 129852 1721044    0    0     0   268 3147 9269  1  4 95  0  0
 3  0 139216  25964 129748 1721196    0    0     2   132 3199 10540  1  4 95  0  0
 1  0 139216  25964 129676 1721332    0    0     0   456 3213 10608  2  4 93  1  0
Show memory statistics using vmstat
Pass the -s option to vmstat command displays a table of various event counters and memory statistics:
Sample outputs:
# vmstat -sSample outputs:
     12195116  total memory
     12020152  used memory
      5697412  active memory
      5475156  inactive memory
       174964  free memory
       375496  buffer memory
      9299280  swap cache
      6291448  total swap
       123368  used swap
      6168080  free swap
      9174417 non-nice user cpu ticks
         2353 nice user cpu ticks
      3338415 system cpu ticks
    831004606 idle cpu ticks
       327853 IO-wait cpu ticks
         9074 IRQ cpu ticks
      1075734 softirq cpu ticks
            0 stolen cpu ticks
      5001944 pages paged in
   1015656377 pages paged out
        28385 pages swapped in
        54024 pages swapped out
   2347308881 interrupts
   1694761409 CPU context switches
   1387092323 boot time
       246261 forks
No comments:
Post a Comment